Contrast sensitivity
Visual information at low contrast levels is important in communication and orientation and mobility but also in seeing black-and-white photographs and pastel colour paintings and pictures. Contrast sensitivity is decreased in many diseases. Corneal opacities, cataract, optic nerve atrophy and retinal degenerations are the most common.
The measurement of contrast sensitivity resembles audiometry: an audiogram depicts which are the weakest pure tones of sound at different frequencies that we still can hear. The contrast sensitivity curve or visuogram shows the faintest contrasts perceived by the person at several spatial frequencies (=using lines with different width or optotypes of varying size). If the stimulus is a sine wave grating then the curve depicts similar function as the pure tone audiogram. If the stimuli are symbols: letters, numbers or paediatric symbols, recognition is required and the result resembles speech audiometry.
The instruction booklets of different contrast sensitivity tests contain detailed information on the theory and practical details of testing vision at low contrast levels. If contrast sensitivity is not a part of basic training at the university, it is advisable to gather a group to discuss assessment of contrast sensitivity.
1. Measurement of visual acuity at low contrast levels uses either back illuminated low contrast VA-charts or non-illuminated charts with one symbol size. The measurement is identical to measurement of visual acuity at high contrast when low contrast VA-charts are used.

Contrast sensitivity can be measured by using low contrast visual acuity charts. The results are marked on the recording sheet at the level of contrast used, e.g. in this picture 2.5% and 1.2%, going along that level toward the left until the visual acuity value, measured at that contrast (A at 1.2%, B at 2.5%), is reached.
Low contrast charts are usually printed at 10%, 5%, 2.5% and 1.2% contrast. Sometimes also 25% and 0.6% charts are also needed. For functional evaluation the binocular value is the most important one. For follow-up of the child's condition it is good to also know the monocular values.
2. Measurement of low contrast vision using the LEA-Screener or the LEA Low Contrast Test requires some thinking before starting. The symbols in this test are 9.5M in size. Thus depending on the child's visual acuity at high contrast you start the measurement at different distances. If the child could see 2.4.M symbols at 40cm, you can start at the standard distance of one meter. If the child only saw 9.5.M symbols at 40 cm, bring the low contrast test to a closer distance where the child can read at least one line on the test, e.g. 20-15cm, after that you can measure at a still shorter distance (see picture below).
When measuring, point to the first symbol on each line and measure until the threshold. For example, if the child sees 4 symbols correctly on line 3 at 1 meter, write down "14 correct at one meter" or "14/1m" (5 on line 1 and 5 on line 2, plus 4 on line 3). Next move the test closer to the distance that the child uses while reading, e.g. 25cm and measure the threshold at this distance. The child may now see 3 symbols correctly on line 5. Write it down as "23/25cm". Mark the result also on the recording form if you want to have a graphic representation of the results. In the beginning this is often found important but soon you will have an approximate image of the graph without drawing it. You find the correct point on the graph by placing your ruler vertically at the distance that you used, marked on the upper edge (in this case at 25cm), and placing your "X" at the level of the number of correct answers (in this case 23).

LEA Screener and the LEA Low Contrast Test have only one symbol size, 9.5M, which corresponds to 0.1 (6/60, 20/200) at one meter. The test distances used (in this case C=25cm and D=2m) are found on the upper edge of the diagram, a line is drawn vertically at those levels and the number of correct answers is located at the left edge of the diagram (E=18 and F=9).The crossing of the corresponding vertical and horizontal lines defines the place of the result on the recording sheet (E' and F'). X=visual acuity value. The contrast sensitivity curve is defined by these three points.
WARNING: When starting the measurement ask the child not to touch the test. During testing, watch that the child does not do it. After use keep the test in its plastic bag in a drawer. If the surface gets smudged use diluted detergent and a smooth cloth to clean it.
 HIDING HEIDI - low contrast face figures allow you to measure the distance at which the child responds to facial features at different contrast levels. This is important in the evaluation of visual communication because the test demonstrates to your fellow teachers, the parents and other care givers how well their features are visible to the child. Ask them to look on their own faces in a mirror and compare their features with the lowest contrast that the child could see. If the features are at a lower contrast than the Heidi face responded to, then they should be accentuated, especially the mouth, using contrasting make up.
Each person can use his/her own features to measure how far the child can copy basic expressions. In a teaching situation it is important to remember which children are able to get visual clues from body language and expressions when the teacher is at the black board and how close the teacher needs to get to be seen well by the student(s) with vision impairment.
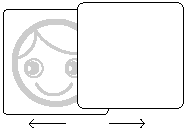
By presenting the test in two different ways, you may get information about motion perception when brain damage is suspected but not proven. First, present the Heidi figure and the white card to the child by lifting them up from a table where they were facing down and keep them steady in front of the child. Secondly, present them by pulling them apart as shown in the above picture. If there is difference in responses in these test situations, report it to the child's neurologist and ophthalmologist.
Previous Chapter 
|
 Next Chapter Next Chapter
|