[ 1-19 ]|[ 20-39 ]|[ 40-59 ]|[ 60-79 ]|[ 80-100 ]
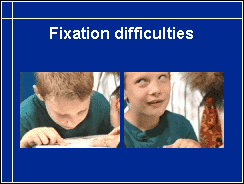
This video depicts a boy with cerebral palsy trying to read. Each attempt to fixate induces a head movement backwards and eye movements upwards. This kind of motor problems require different reading techniques. Either the text is so large on a screen that it can be read when eyes slowly move past it or the child reads the text with reading glasses that fully compensate accommodation so the child just stares in front of him without attempting to fixate exactly on the words that scroll on the screen. If the hands function well enough, Braille may be considered. Talking books are often necessary materials even if visual acuity may be normal. (See the video.)

Visual functions are measured several times before school age and functions like visual acuity and visual field are usually clearly reported by the child's ophthalmologist. However, for the classroom work we need to measure visual acuity with several tests: single optotypes, line tests, tests with crowded optotypes to assess how the visual system handles different kinds of small details.
There are now simple tests to assess all part functions of vision at school in the classroom situation, in the dining room or during physical education.
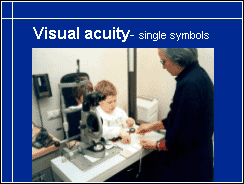
Measurement of visual acuity with single symbols reveals the recognition of small details when there is no surrounding visual information interfering with the task.
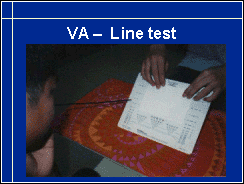
Line test is the standard test of visual acuity and should be used as early as the child is able to perform in this test situation.
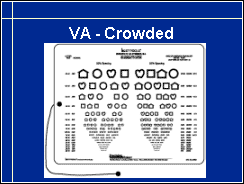
When the child is learning to read, visual acuity needs to be measured with more crowded groups of symbols. This visual acuity depicts reading acuity better than the other two acuities but each of them is worth measuring.
|
|
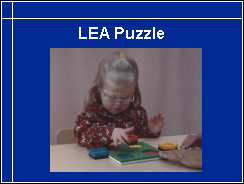
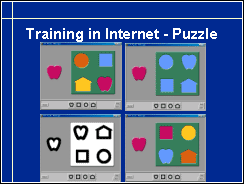
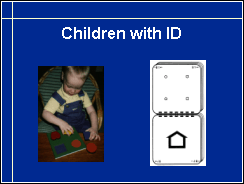
Children with intellectual disabilities may need to train the test symbols with the LEA Puzzle where they first learn to match colours, then black-and- white forms.
The LEA Puzzle can be trained as an internet version where the colours of the puzzle pieces and those of the cut-outs vary.
|
|
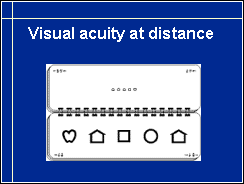
For them there is a distance test with single symbols and another with only one line on each card. This one line test is a screening test and therefor does not contain all symbol sizes of a visual acuity chart.
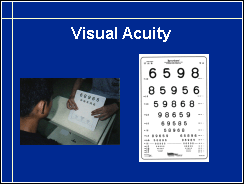
Visual acuity should be measured using standardised illumination. This is made possible with the small lightbox where tests with different optotypes, symbols, numbers and letters can be used. Still at the age of 8 years children find numbers easier than letters, even if they are fluent readers. When changing from symbol tests to number tests, it is advisable to measure both values because visual acuity with the more difficult optotypes may be worse than with symbols. The same applies if visual acuity later is measured with letter charts.
Visual acuity tests for the small lightbox have their largest optotypes corresponding visual acuity 0.16 (20/120, 6/40) at 3 m distance. When moved to one meter the size corresponds to visual acuity 0.05 (20/400, 6/120). If still larger optotypes are needed, the Colenbrander chart for 1m test distance can be used.
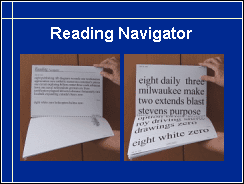
When a child can read, optimal text size is measured using random words. Then reading speed is measured with texts appropriate to the age and reading level of the child.

If optotype tests are too difficult, resolving power of the visual system can be measured using grating acuity tests and visual functions at low contrast levels with Hiding Heidi as we measure them in infants.
In this short video you see the infant responding with gaze shift to gratings and low contrast pictures of smiling face. Actually, infant's smile reveals that he not only sees the picture but responds also to its content. (See the video.)

Grating acuity tests measure a much larger area of the visual field than optotypes. If there is distortion or loss of function in the centre of the visual field, as shown in this slide, the child can still respond to the fine lines seen in the adjacent visual field. Grating acuity values must never be converted to optotype acuity values, because the tests measure different functions. Grating acuity values below 6 cycles per degree may not be perceived at the cortical level but depict responses of the superior colliculus.
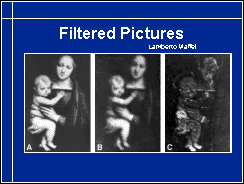
This slide with three pictures of Madonna and Child is one of the slides I hope you will show often. It reveals a poorly known fact: important visual information is not transferred with fine lines, that correspond to good visual acuity but within the range of low vision!
The picture to the left is a usual photographic copy of the painting. The picture in the middle was made by Professor Maffei so that all fine lines above 5 cycles per degree (cpd) were filtered away. The picture to the right was made by filtering all lines below 10 cpd and leaving only the finest lines. As we see, the picture in the middle contains more useful visual information than does the picture to the right. Visual information at low acuity and low contrast levels carries the features of image that enable us to see the surface of round objects in three dimensions.
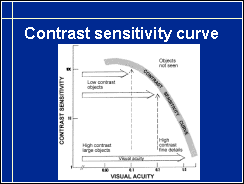
We see the same information in this picture of contrast sensitivity curve: visual system is more sensitive at intermediate and low spatial frequencies than at high frequencies. Therefore function at low contrast levels should be carefully assessed.
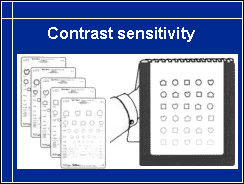
Contrast sensitivity tests for schools have been low contrast visual acuity charts for the small lightbox and charts with one size of optotypes at six different contrast levels.
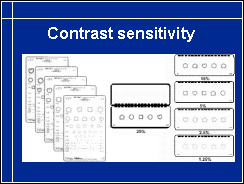
The non-illuminated charts are now printed in a new way: each line on a separate page. This is caused by changes in the printing techniques.
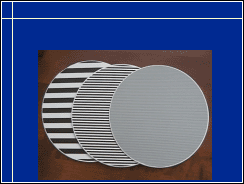
Contrast sensitivity can also be measured as low contrast grating acuity. The test is still a prototype but should be available early next year. Low contrast grating acuity is likely to depict vision for orientation.
From this information related to visual acuity at different contrast levels and grating acuity, it might have become clear that a single distance visual acuity value does not depict quality of impaired vision. Much more needs to be known.
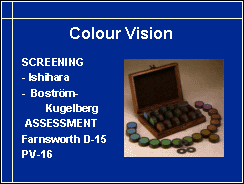
Colour vision is assessed with quantitative colour vision tests, like Farnsworth Panel D-15 (which, however, does not have a plastic film on the colour surfaces and therefore is easily ruined by the little fingers) or the Panel-16 colour vision test that has larger and smaller colour surfaces and a thin layer of plastic covering the colour surfaces to protect them from smudging. A complete guide is on the CD at the Instruction Section of the Vision Tests.

On my webpage there is this Colour Vision Game with its three different variants. With it you may train a child to match colours. During the game you will learn whether there are any major confusions between colours. The game does not replace the proper test because the colour calibration of the computer screens varies.