[ 1-18 ]|[ 19-37 ]
Texts of LHs lectures in Lima:
Lecture 1:
Current questions in clinical work
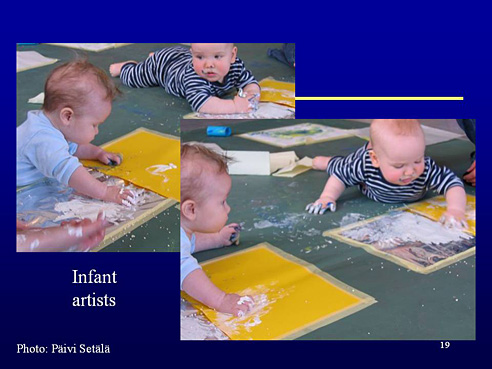
Slide 19. Watching adults’ and infants’ motor activities is an effective way in learning new motor skills.
Slide 20. These three early signs are “red flags” in infancy. An ophthalmologist should rule out refractive errors and other causes of poor image quality that could restrict infant’s early communication. If no problems are found or after correction of refractive errors and improving the image quality, the infant still does not have typical development, a paediatric neurologist should investigate the possibility of prosopagnosia, face blindness and other specific losses due to brain damage.

Slide 21. In the lateral geniculate nucleus (LGN) the first neurons pass the information to the second neuron of the visual pathway that contains only these two long axons and is therefore vulnerable to vascular insults and accidents.

Slide 22. The picture on the left on this slide shows the visual pathways from retinas to primary visual cortex and the representation of visual field in the primary visual cortex. The picture on the right side of the slide is a simple schematic drawing showing the connections of the LGN with the surrounding structures and the numerous connections from the visual cortices for the Top-Down flow of visual information.

Slide 23. I have designed this animation (technical solutions by Heli Ruoho) to make it easier to remember that 1) the amount of visual information from the LGN is smaller than the amount of visual information coming into it (the bolus leaving the LGN is smaller than the bolus coming into it), 2) there is huge amount of information from the visual cortices flowing to the LGN. One theory suggests that there is delay in the flow of information within the LGN so that the previous information has time to return to the LGN and functions as a template for comparison with the new information. Only the difference between the two pieces of information is sent to the brain, which would greatly facilitate the function.
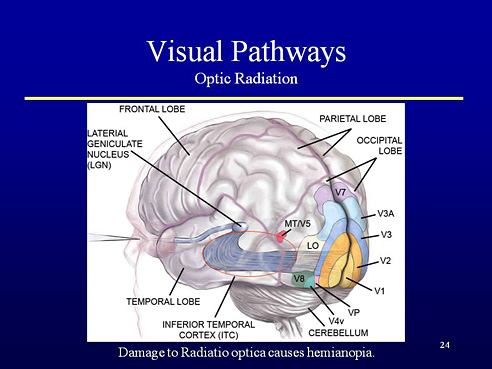
Slide 24. Optic radiation bends along the wall of the ventricles and is often damaged due to hypoxia/ asphyxia before, during or soon after birth, sometimes later during childhood due to accidents, near drowning, non-accidental disorders, etc. leading to visual field defects, hemianopia, quadrantanopia, and constriction of the visual field.
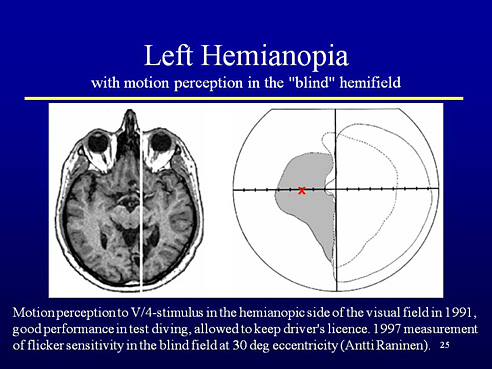
Slide 25. In many cases of hemianopia, the loss of functions is loss of form perception but motion perception is present and can be demonstrated using the V/4-stimulus of the Goldmann perimeter and moving it within the “blind” area as fast as possible. The patient can report that he does not see what is moving but there is movement in the area of poor perception. These cases can be trained to become better aware of the “blind” area by using flicker stimulation, which in this case was placed at an eccentricity of 30 degrees (X).
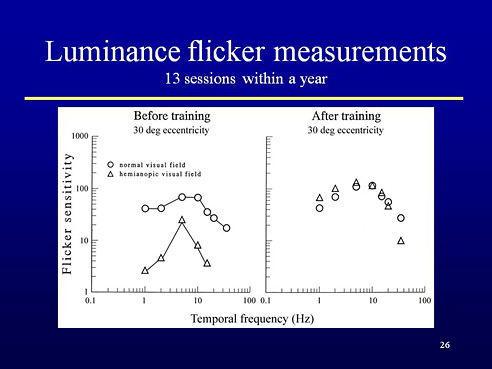
Slide 26. The diagram on the left shows the curves of flicker sensitivity on the normal and on the “blind” half of the visual field at 30 degrees eccentricity. There was measurable sensitivity on the “blind” side, the function on the normal side was typical.
The measurements were repeated after a month and the thresholds on the blind side had become lower, the function had improved. The patient had time to come to our lab only once a month. After 13 sessions during a year the two curves were identical; flicker sensitivity had improved in the “blind” side, not only at the point of stimulation and training the shift of attention into it but in the central visual field between this point and the edge of the V/4- isopter at 10 degrees eccentricity (macular sparing). This kind of improvement has been seen in many patients.
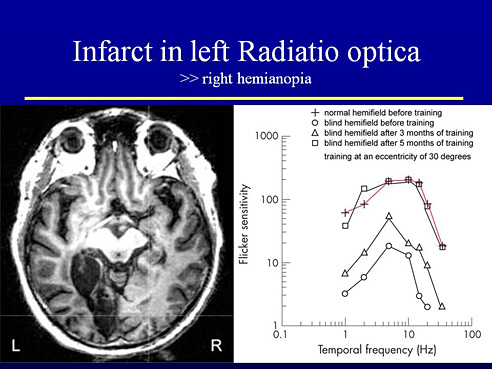
Slide 27. In another patient with large area of damage to the left optic radiation caused total loss of function on the right side of visual field in Goldmann perimetry. There was measurable flicker sensitivity in the blind, right half field and during stimulation sensitivity became symmetric with the function in the normal side of the visual field (the curves of the “blind” side become closer and closer to the curve of the normal side, which did not change.
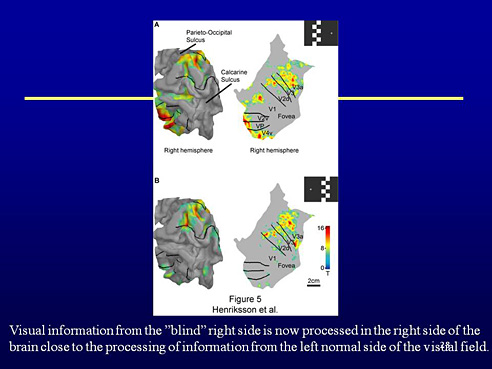
Slide 28. The function in the occipital lobes was recorded monthly using MEG and fMRI. The upper pictures show the results of measurements when the flicker sensitivity was measured in the left normal field half at 30 degrees eccentricity. The lower pictures show the results when the flicker sensitivity was measured in the right “blind” field half. The processing of visual information from the “blind” field half had moved to the ipsilateral right side of the brain!
If this can happen in a person at the age of 60 years, it certainly can happen in infants and children with much greater plasticity of the networks of the brain.

Slide 29. The cortical areas of the occipital lobe are called visual cortices V1 to V8 but also other sensory information and short time memory are represented in these cortical networks.
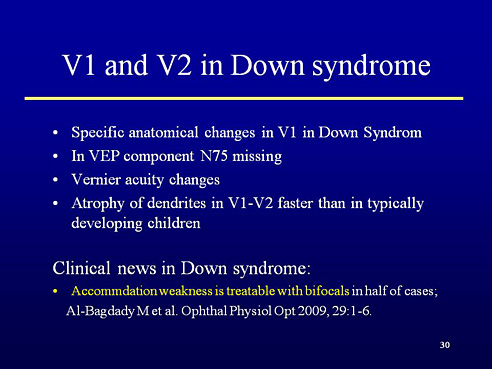
Slide 30. New findings are made on the function of visual cortices. As an example in children with Down syndrome, the anatomic structure of the primary visual cortex differs from the typical findings. Also the atrophy of dendrites is faster than in typically developing children. VEP and Vernier acuity can be assessed and show deviations from typical function. These findings mean that the incoming visual information does not have the same quality as visual information in their typically developing peers.
In the follow-up of children with Down syndrome an interesting finding was made recently: in some children who have had bifocal spectacles because of their weak accommodation, focusing has improved over the years so that about one third of children now accommodates normally, another third better than before but not normally, i.e uses weaker near corrections and the rest needs to use their old spectacle corrections to see well at near. This finding shows how important it is to refract and prescribe spectacles is in all groups of children with changes in sensory or motor functions in vision.
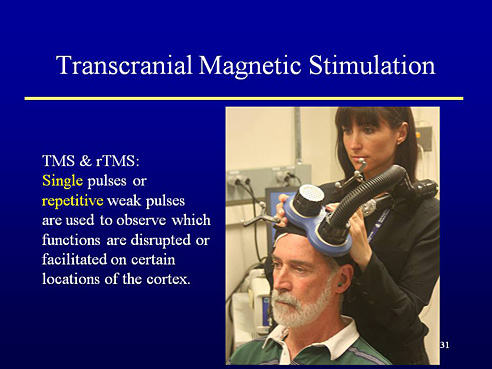
Slide 31. This slide is shown as an example of new techniques that are coming from the research laboratories to clinical work. Transcranial magnetic stimulation allows observation of changes in local activities after single pulses or repetitive pulses. Mapping of functions is tedious work because all visual tasks show activation in numerous areas of the brain.
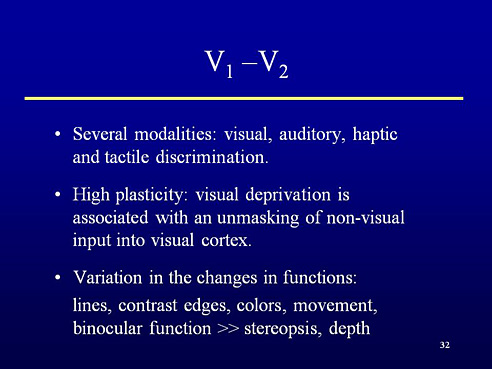
Slide 32. It has been known for years that in blind individuals visual cortices are used for processing auditory and tactile information. Recent studies using transcranial magnetic stimulation and short time complete visual deprivation have revealed presence and improved use during deprivation of tactile and haptic spatial information, and presence of auditory information and short time memory in these cortical areas that have been taken as purely visual in function.
The presence of short time memory at this site of early processing makes it easier to understand why after reading small text it is difficult to remember the content; too much of attention has been directed to the deciphering of the image and less than usual amount of attention is available for memorising the content.
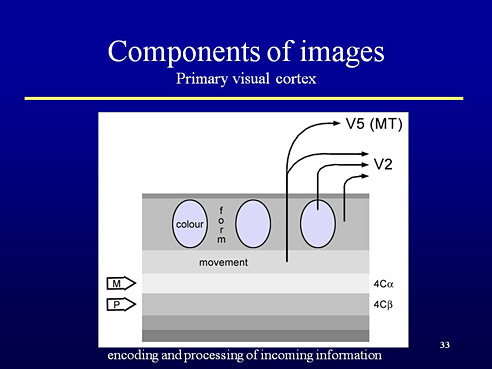
Slide 33. When the visual information arrives in the primary visual cortex through the parvocellular and magnocellular pathways the information related to colours is coded in round groups of cells called blobs. Information related to contrast edges, lines is coded in the “interblob” areas and information related to motion in another layer of the primary visual cortex. Information moves then through the specific visual cortices to be then used in the ventral or dorsal networks. Motion related visual information is also passed directly to V5 area where it meets motion information coming through the fast tectal pathway. The puzzling feature in the coding and transmission of information in brain is this question: when information from a moment in time moves through different pathways of different length and different speed of transmission, how can the pieces of information be coded so that when combined at the cortical level the pieces of information coming through different channels find each other. Espanjankielisessä diassa Cor >> Cores sinisellä pohjalla, kuten engl.
Slide 34. The basic sensory components of vision are thus forms, colours and movement. Thus these basic components should be assessed, which does not happen in the clinical examination of visually impaired children who might have changes in any of these functions. For example, loss of parts of motion perception is a more common disorder than what is known today.
If the child is binocular and fuses the information well enough, stereovision is a result of the early processing, as is information for perception of object-background, figure-ground and filling in for lacking information (visual closure).
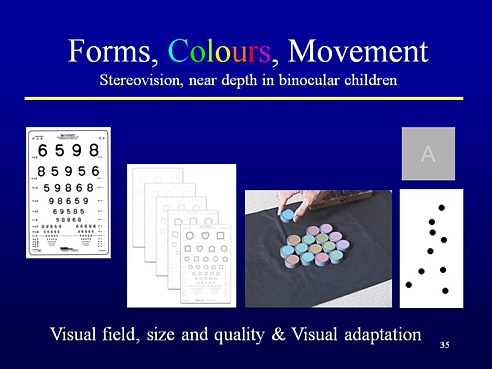
Slide 35. Form perception is usually measured only with high contrast visual acuity charts at distance although children use their vision at close distances for learning and mostly at intermediate and low contrast levels. Colour vision of visually impaired children is usually measured with screening tests although they do not give correct answers if contrast sensitivity is low. Motion perception tests for children should be developed further to cover different directions and speed ranges.
In addition to the above measurements also the size and quality of visual field and visual adaptation to different luminance levels should be assessed before we start to evaluate visual processing functions.
Slide 36. As shown in this slide, we should use the vision tests critically asking ourselves whether we know what we are actually measuring. Clinical tests depicting specific visual functions like visual acuity, contrast sensitivity or visual adaptation are taken as tests of visual functions in the eyes. However, the results of these tests are results of cortical functions similar to face recognition or visual awareness of space, which are felt to be “neurological functions”.
Visually impaired children often have other disabling conditions that need to be considered during assessment. Findings in vision tests should be discussed with the other rehabilitation teams and activation of visual functions included in the general plan of early intervention, rehabilitation and education. Compensatory strategies may look strange if the underlying condition is not known in detail. Both compensatory strategies and limiting visual factors should be discussed in detail with all persons involved in the care and education of children.
We should consider functioning as it is described in the International Classification of Functioning, Disability and Health, Version Children & Youth, the WHO document for collaborative work between medicine, education and social services making it the foundation of our work.

[ 1-18 ]|[ 19-37 ]