Introduction to
Grating Acuity Tests
Lea Hyvärinen, MD
Grating tests have been used to measure contrast sensitivity since the 1960s and became popular as Grating Acuity Cards for detection grating acuity at full contrast in 1980s. The computer-controlled grating tests have not become widely used in clinical medicine because they are expensive and require an experienced technician to use them. However, studies of computer-controlled grating tests have provided important principles in measuring contrast sensitivity in cases of impaired vision1-4.
In the assessment of impaired vision, the most important finding is that, in nearly all cases, grating acuity at full contrast and contrast sensitivity values are different when measured with gratings of different sizes; i.e., the larger the grating, the higher the highest contrast sensitivity value. This is particularly common in cases of central scotoma that “eats up” some of the stimulus and, thus, the effective stimulus is smaller than the physical stimulus.
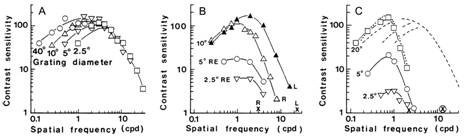
Figure 1. A. Contrast sensitivity as a function of stimulus size in normally sighted subjects: The larger the grating, the higher the contrast sensitivity values at low spatial frequencies. Note that the slope of the curve remains the same. B. Contrast sensitivity curves in a case of macular degeneration, L = the normal left eye, R = the right eye with dry macular degeneration. Contrast sensitivity measured with 10 degree stimulus is nearly as good as in the normal left eye, whereas when measured with 5 degree stimulus, it is one fifth of the maximum value of the 10 degree curve and when measured with 2.5 degree stimulus, the maximum value is only one twentieth of the 10 degree maximum. C. Contrast sensitivity curves of a person with optic atrophy in both eyes. With the 2.5 degree stimulus, contrast sensitivity is barely measurable; yet, with the 20 degree stimulus, the values at low spatial frequencies are normal. The Figure 1.C also shows that during remission visual acuity improved from 0.06 (x) to 0.4 (![]() ) whereas there was no change in the grating acuity, even when measured with 20 degree stimulus. (Pictures from references 1 and 2).
) whereas there was no change in the grating acuity, even when measured with 20 degree stimulus. (Pictures from references 1 and 2).
1. Effect of the size of the stimulus
As seen in Figure 1, small grating stimuli often give a misleading picture of visual function. Therefore, it is wise to make one measurement with a large grating stimulus to learn about the subject's ability to see low contrast or full contrast information. On the other hand, it is interesting to evaluate the function of the fixation area by using a smaller stimulus. This is possible by covering the large grating stimulus with a grey folder that leaves one-tenth of the stimulus visible.
A.
B.

C.
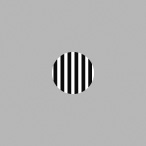
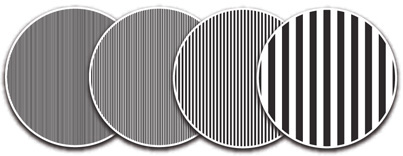
Figure 2. A. For the measurements of the grating acuity at full contrast there are four gratings, 8 cpcm, 4 cpcm, 2 cpcm, and 0.5 cpcm (cpcm = cycles per centimetre of the surface). B. For the measurement of contrast sensitivity there are nine gratings. C. Grey cover with a 6.3 cm opening.
Because the number of pairs of lines (cycles) of the 0.5 cpcm grating visible through the small opening (6.3 cm diameter) is less than 5, the threshold values are slightly affected by the small number of cycles. The other gratings have adequate number of cycles visible in the opening.
2. Perception of gratings
When assessing vision of a child or adult, it is important to know that some individuals perceive gratings as irregular patterns and not straight lines and, therefore, cannot define the orientation of the lines. It is also possible that the person does not perceive the gratings at all, which is rare but will be found in individuals with brain lesions, which may not affect the person’s vision in any other way. Therefore, it is wise to demonstrate the gratings by showing the 0.5 cpcm, 2 cpcm, 4 cpcm, and 8 cpcm gratings at full or 10% contrast at a close distance when beginning the test and asking how the child/person sees the gratings.
If the person answers that “the broad lines are regular straight lines in this direction but the other ones are irregular in the middle and the really fine lines wiggle and are not straight at all”, then you have made an important observation at the beginning of the test and know that the person has problems in perceiving many straight lines. This difficulty in visual perception can be detected with no other clinical tests but gratings and asking how the gratings are perceived. If gratings are used as a detection test (Teller Acuity Cards, LEA GRATINGS), we are not aware how the child perceives the gratings. If a child does not know how to describe the grating lines, as him to use his finger as a car and “drive first on the broad road carefully in the middle of the road” and then the “narrower and narrower roads” and when the 8 cpcm is presented. If the finger moves smoothly and directly on the 0.5 cpcm line but starts to wiggle on the 2 cpcm or 4 cpcm “road” the child may say “no lines” or “a mess”. This information is important because it means that many thin lines cannot be correctly encoded. In everyday life it means that for example cutting along threads is not possible and millimetric papers cannot be seen.
3. General about testing
During testing the test grating is moved away from the person being tested until the individual can no longer discriminate the direction/orientation of the grating lines. Then the grating is brought closer to the person until the person can perceive the grating and its orientation. This distance is defined accurately by moving the grating farther from and closer to the person and measuring the threshold distance 5 times. Children may not tolerate so many measurements; we often have to be happy with 2 to 3 measurements, especially if the values are measured at nearly the same threshold distance.
The direction of the lines should be varied randomly. However, it is wise to not show the same direction a second time immediately after the first presentation. You should also not show the lines in a direction that the person has just used in his answer (wrong answer) because people tend not to repeat an answer. Therefore, two presentations of the same orientation of the lines will likely result in an incorrect response to the second presentation.
If a person has uncorrected astigmatism, gratings will be seen at slightly different distances when presented in different orientations. This allows you to learn about the person's refractive error while measuring grating acuity.
4. Angle of vision
It might be helpful to refresh the concept of visual angle. When a surface is held at 57.2 cm (~ 2 feet) distance from a person's eyes, one centimetre of the surface equals one degree of visual angle.
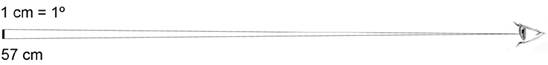
Figure 2. The visual angle of an object is the angle in space it has in relation to the eye. In this case the 1 cm high object is at a distance of 57 cm from the eye. It is, thus, within one degree of visual angle.
The distance of 57 cm is derived from the formula 2 π r. A circle is 360° and the circumference of a circle is equal to 2 π r, where r is the radius. If the circumference of a circle measures 360 cm, each degree subtends to 1 cm on the circumference. The radius of such a circle, r, is calculated:
r = 360 cm / 2 π = 57.2 cm.
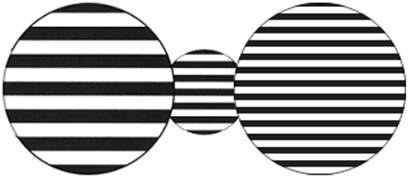
Figure 3. When a grating is moved farther it seen smaller and the lines are closer each other, i.e. the frequency is higher. In this picture there is a 0.5 cpcm grating at the distance of 57 cm from the camera on the left, another 0.5 cpcm grating at 229 cm from the camera in the middle, and a 2 cpcm grating at 57cm from the camera.
By moving a grating to different distances, it is possible to measure different threshold values. At the same time the size of the grating changes. Since the size of the stimulus is smaller, it covers a smaller area on the retina. Often there is more changes in the central visual field more than in the surrounding area. In such a case grating acuity value is lower when measured with the lower stimulus. The smaller size of the stimulus is also achieved by showing the grating through an opening (Figure 2.C).
References:
- Hyvärinen L, Rovamo J, Laurinen P, Peltomaa A. Contrast sensitivity function in evaluation of visual impairment due to retinitis pigmentosa (1981) Acta Ophthalmol (Copenh) 59:763-773.
- Hyvärinen L, Laurinen P and Rovamo J. Kontrastempfindlichkeit bei Degenerationen der Macula und des Nervus opticus (1982) Fortschr Ophthalmol 79:166-168.
- Hyvärinen L, Laurinen P, Rovamo J. Contrast sensitivity in evaluation of visual impairment due to macular degeneration and optic nerve lesions (1983) Acta Ophthalmol (Copenh) 61:161-170.
- Hyvärinen L, Laurinen P, Rovamo J. Contrast sensitivity in evaluation of visual impairment due to diabetes (1983) Acta Ophthalmol (Copenh) 61:94-101.
[ Instructions I Paediatric Vision Tests I Vision Tests ]
This document was last modified on