1. Visual pathways
Our goal in the functional assessment is to learn about children's visual capabilities and problems to better understand their needs during early intervention and in special education. This information is applicable to rehabilitation of adult persons as well.
The assessment has three stages:
1. The quality of the incoming visual information. Its quality can be affected by changes in structures of the eyes, the optic nerves, the long visual pathways or because of irregular oculomotor functions. The image quality we assess by measuring visual acuity, contrast sensitivity, visual field, colour vision, visual adaptation, binocular vision and stereoacuity.

2. The quality of higher visual functions. In special education and psychology they are called cognitive visual functions. All the tests mentioned above require cognitive visual functions. The measurement of visual acuity for example is based on recognition of abstract geometric forms, letters, numbers or paediatric symbols, all called with a common name, optotypes.

3. The effect of visual impairment on the development and special education of the child. In an adult person’s life the corresponding questions are further education, working conditions, social security and independence. The main difficulty between children and adult people is the fact that children are developing their brain functions based on visual information that deviates from normal often from the very beginning. The type and severity of changes in visual functions varies from child to child. Each child's functional situation needs to be assessed, which includes the effect of visual impairment on the present condition, the past experiences and the prognosis of the disorder.
To start the assessment, we need first to consider a few facts on visual information and pathways. Visual information is composed of three components.
We see forms, we see colours and we see movement. Each of these three components should be assessed in a functional assessment, which does not usually happen. In low vision assessments, only a part of form vision, recognition of optotypes, i.e. visual acuity at high contrast is measured, but not at low contrast. Recognition of facial features or facial expressions and perception of orientation of lines or perception of size are not assessed at all. Colour vision is rarely assessed during a low vision assessment; motion perception is measured only in a few experimental laboratories.

We need to measure also such variables as the size and quality of the visual field, visual adaptation and oculomotor functions.
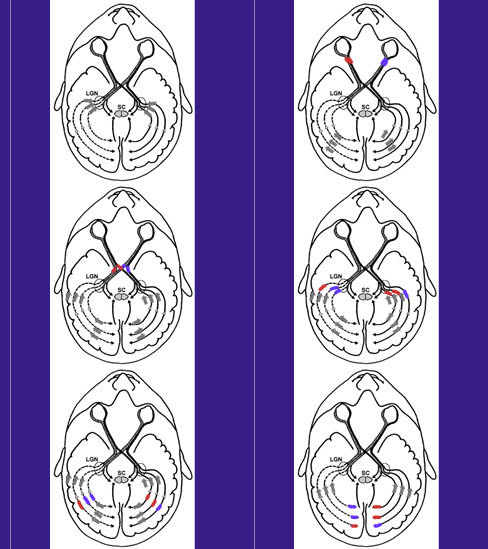
This picture 8.A of visual pathways is well known from the precourse reading of "Eyes and Vision". Visual information is transferred from the ganglion cells of the retina through the long nerve fibres to the lateral geniculate nucleus (LGN) where they pass the information to the next neuron that transfers it to the primary visual cortex, V1. As you see in this picture, visual information is simultaneously transferred via another pathway to specific groups of cells close to LGN called superior colliculus (SC). Note also that there are pathways to bring information from the primary visual cortex backwards to the LGN and SC. This loop and several other features of the visual pathways function as an effective filter inhibiting parts of visual information from getting into the higher cortical functions. Because of the tremendous amount of visual information flowing in, much of it must be filtered away so that the functionally important components can be effectively used. The slide 8.B depicts this flow of inhibiting information coming toward the LGN. Similar selection of visual information occurs at all cortical levels, the present processing has an effect on what is “chosen” from the incoming information.
What we perceive of world is much more a composition of our brain than an exact image of the surrounding physical structures.

This side view of the visual pathways depicts their structure even more clearly. Visual pathways have two major routes, the retinocalcarine pathway from the retina via the optic nerve (ON), optic chiasm (CH) and the lateral geniculate nucleus (LGN) to the primary visual cortex (called also calcarine cortex) and the tectal pathway via the superior colliculus (SC) and the pulvinar (P) to the associative cortices. Visual pathways transfer information through different neural pathways. The largest path (approximately 80% of the nerve fibres) is the parvocellular pathway that transfers all colour information and high contrast black and white information. Its nerve fibres are thin and transfer information relatively slowly. The magnocellular pathway (10% of the fibres) transfers all motion related information and low contrast black and white information. Its fibres are thick and have high speed of information transfer. From the primary visual cortex information flows into two main directions, toward the parietal lobe as the dorsal stream (DS) (the 'where' functions) and toward the temporal lobe as the ventral stream (VS) (the 'what' functions). There are effective feedback loops at all levels of the pathways; the visual pathways are 'two way streets'.

The magnocellular pathway carries information from the large retinal ganglion cells to the large cells in the LGN (magno=large in Latin) and from there to the primary visual cortex, V1 within the retinocalcarine pathway and over the SC to numerous subcortical functions and to the parietal visual functions. This magnocellular pathway carries all transient, motion related visual information and low contrast black-and-white information. Since the fibres are thick, the speed of transfer is high. The magnocellular pathway is more prominent in the tectal pathway than in the retinocalcarine pathway.

In this slide we see one type of transient visual information, luminance flicker. The information is created by repeatedly showing two surfaces with different luminance levels, a short time each. By making the luminance levels of the two surfaces closer and closer to each other, the contrast between them decreases. When the difference becomes small enough, flicker cannot be perceived any more, the threshold for sensitivity at that flicker frequency has been reached.
This slide depicts a grating that seems to move. When the grating is displaced a fraction of the width of its lines at a time, we perceive motion. By varying the speed of the movement and the width and contrast of the lines, thresholds for perception of movement can be measured.
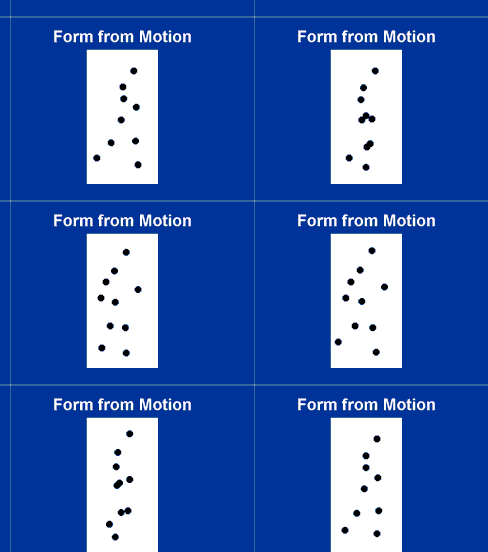
Motion perception can also be measured by using groups of dots that, when all moving with the same speed, are seen as a form in motion (Pepi test). Very few moving dots convey us the function as seen in the slide 12.B.

The parvocellular pathway from the small retinal ganglion cells carries all colour information and is effective in carrying high contrast black-and-white information. The nerve fibres are thin and thus the speed of transfer is low. In the optic nerve 80% of the nerve fibres are parvocellular fibres and 10% of the fibres are magnocellular fibres.

You can experience some important features of visual pathway functioning in this and the next slide: You see that there is a grey dot at the upper right hand corner and a STOP-sign at the lower left hand corner. Keep looking at the STOP-sign for a few seconds. The grey dot disappears if you keep your gaze on the STOP-sign all the time. You should look on the picture so that the grey spot falls within 15-20 degrees of your central visual field.

On this slide there are the grey dot and the STOP-sign and in addition a flickering dot. Even if you now keep your gaze fixed on the STOP-sign you see the flickering dot. If you can look steadily on the STOP-sign you notice that not only the flickering dot remains visible but also the grey dot appears now and then. Transient visual information facilitates the use of sustained visual information.

From the primary visual cortex visual information is spread to more than thirty cortical areas for specific 'higher' visual functions. There are two main directions of the flow of visual information, toward the parietal lobe as the dorsal stream and toward the inferotemporal lobe as the ventral stream.

Within the ventral stream are recognition functions, colour perception, object background perception, whereas within the dorsal stream are functions like eye-hand coordination and orientation in space, both egocentric and allocentric space.

If you keep this picture of the visual pathways in your memory when you assess visual functions you remember to observe the many parallel visual functions. It also makes it easier to understand why isolated visual functions may be disturbed or lacking while other functions are normal or near normal.

In summary: Visual system is a system of parallel pathways: In the eyes there are two sensory systems, cone cells for daylight vision and rod cells for twilight vision. (More details on sensory cells you find in the part on retina.) In the optic nerves and visual pathways there are several different types of nerve fibres, of which the magnocellular and the parvocellular pathway are the most important. Visual information reaches cortical and subcortical visual functions via the retinocalcarine pathway or via the tectal pathway. From the primary visual cortex information flows either toward the parietal lobe as the dorsal stream or toward the temporal lobe as the ventral stream.


