Clinical examples of measurements with optotype tests
The line between full contrast VA and VA at 2.5% contrast is a straight line in normally sighted and most visually impaired individuals. Therefore it is possible to shorten the measurement by measuring first at 2.5% contrast and if the person does not see optotypes on that contrast at 3 meters, then move the 2.5% test chart closer (1.5 m or 1 m distance) or use the 10M test. In many cohorts, the slope of the contrast sensitivity curve is defined with the one measurement at 2.5% contrast, which makes the test fast and easy. As an example, a cohort of 50 school children with cerebral palsy (CP):
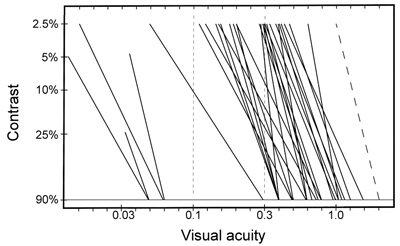
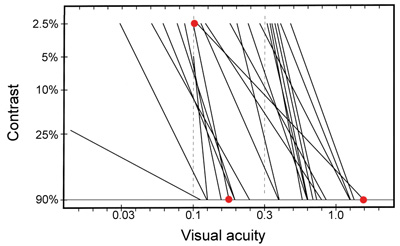
Figure 4. The declination of the slope, i.e. the angle between the slope and the X-axis varies independent of the visual acuity at full contrast. Visual acuity at full contrast does not predict low contrast value but often it is close to half of the full contrast value, slightly lower or higher. Out of these 50 children with motor problems, mostly CP, all but 5 had a result at the 2.5% level. Two children saw nothing at lower contrast than 25% and 3 children reached 5% level. The dashed line shows the declination of the slope of young normally sighted adults but the slope is moved from 1.25 to 2.0 on the X-axis. Note that one of the two children with visual acuity 1.6 (20/12, 6/3.5) at full contrast has very low visual acuity at 2.5% contrast, 0.1 (20/200, 6/60), which is the same as that of the child with visual acuity 0.18, marked with red dots.
Contrast sensitivity in young healthy children
In a group of 40 healthy children, 34-59 months of age, binocular testing was possible in all of them and monocular testing was possible in 24/26 children older than 44 months. Figure 4 shows that children reach adult like contrast sensitivity at the age of three years: at 2.5% contrast all children had a visual acuity mean of 0.3 (6/18, 20/60) and half of the group older than 44 months had visual acuity 0.3 at 1.2% contrast, like the young adults, during the first measurement with the LEA 10M Symbols test. All children had mean visual acuity 0.1 at 1.2% contrast. The youngest children lost their motivation when the optotypes were small at full contrast. They were accustomed to go closer in order to see such small details.
Figure 4. Mean values of contrast sensitivity curves of young adult people (bold line), 5-year-old children (dotted line) and 3-year old children (grey line). At the lowest contrasts, the mean values are equal or nearly equal but the right hand side of the curve, the slope of the curve of the youngest group comes down at a lower visual acuity than the other two curves. (Unpublished teaching material from 1984).
![]()
![]()
![]()
[ Instructions I Paediatric Vision Tests I Vision Tests ]
This document was last modified on