Low Contrast
Grating Acuity Tests
Low contrast grating tests have been used to measure contrast sensitivity since the 1960s. The computer-controlled tests showed that the contrast sensitivity curve of visually impaired people with changes in the central visual field often differs in its structure from the norm: when the stimulus decreases in size, the slope of the curve moves to the left and the maximum value may decrease dramatically (Figure 7.B and C). The central scotomas “eat up” some of the stimulus and, thus, the effective stimulus is smaller than the physical stimulus.
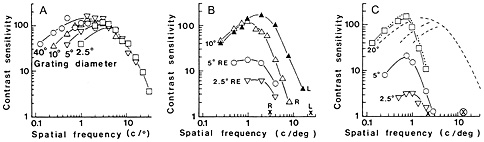
Figure 7. A. Contrast sensitivity as a function of stimulus size in normally sighted subjects: the larger the grating, the higher the contrast sensitivity values at low spatial frequencies but the slope remains in the same place. B. Contrast sensitivity curves in a case of macular degeneration, L = the normal left eye, R = the right eye with dry macular degeneration. Contrast sensitivity values measured with a 10 degree stimulus were nearly as good as in the normal left eye, whereas when measured with 5 degree stimulus, they were one fifth of the maximum values of the 10 degree curve and when measured with 2.5 degree stimulus, the maximum value was only one twentieth of the 10 degree maximum. C. Contrast sensitivity curves of a person with optic atrophy in both eyes. With the 2.5 degree stimulus, contrast sensitivity is barely measurable; yet, with the 20 degree stimulus, the values at low spatial frequencies are normal. Note that the optotype acuity of the better eye (marked with x in a circle at the X-axis) was 0.4, i.e. higher than the grating acuity value 2 cpd. (For reference see Hyvärinen L et al. Acta Ophthalmol 1981, 59:763-773; 1983, 61: 94-101, 1983, 61:161-170, and 1983, 61:742-750.)
As seen in Figure 7, use of small grating stimuli results in misleading values of visual function at low contrast levels if the central visual field is not normal. Therefore, the LEA Low Contrast Grating Acuity Test was designed to facilitate measurements with a large grating stimulus to learn about the subject's ability to see low contrast information in the environment, and on the other hand, evaluate the function of the fixation area by using smaller stimuli. This is possible by using the test gratings at different distances. At a greater distance the test grating is seen smaller and its lines are seen thinner, i.e. there are more lines within a degree of visual angle, the frequency of the grating is perceived higher.
When assessing vision of a child or an adult for the first time, it is important to know that some individuals perceive gratings as irregular patterns and not as straight lines and, therefore, cannot define the orientation of the lines. It is also possible that the person does not perceive the finer gratings at all, which is rare but will be found in individuals with brain damage. Therefore, it is wise to demonstrate the gratings by showing the 0.5 cpcm, 4 cpcm, and 8 cpcm gratings at 10% contrast at a close distance when beginning the test and asking how the child or adult sees the gratings. If the person answers that “the broad lines are rather regular straight lines but the other ones are not, and they wiggle”, then you have made an important observation at the beginning of the test and know that the test might be difficult to the subject/patient. These are the individuals who may have high normal visual acuity but yet have a grating acuity of 4 – 6 cpd, a tenth of the expected value if the relationship between recognition acuity and grating acuity were normal.
You may have noticed that visual acuity 1.0 (20/20, 6/6) is said to be equal to 30 cpd and vice versa but this is true only to the physical structure of Snellen E and gratings because the E is a mini grating. Visually impaired persons’ grating acuity is often better than their visual acuity (Figure 7.B) but it can be also worse (Figure 7.C) .
There has also been a tendency to measure visual acuity at full contrast with optotypes but at low contrast levels with grating tests. However, contrast sensitivity curve based on measurements with optotype tests is a curve different from the curve based on measurements with grating tests. These two curves depict very different visual functions, one of the two curves depicts recognition of forms at different contrast levels, and the other curve depicts resolving long and short lines and edges at different contrast levels.
Measurement of grating acuity at full and at low contrast levels can be greatly disturbed if the lines are not perceived as straight lines but distorted, usually the more the finer the lines are.
Cambridge
Low Contrast Gratings
Cambridge Low contrast Gratings is not a LEA test but I have used it as long as it has been available as a low contrast pair of my LEA GRATINGS test. Both are detection tests.
The instructions that come with the test are written for measurement of central contrast sensitivity, the stimulus is small at 6 m distance. Measurements of young children must be made within the visual sphere of the child. The limiting distance is the distance where the child starts to see the individual dots. There is a table on cpd values at different distances based on the fact that one cycle is 2.54 cm. At the distance of 57.2 cm the cpd value is thus 0.4 cpd.
One test at least has arrived without the table of contrast sensitivity values, so that table is also copied here. For example, if a child saw as the last correctly perceived page first 7, then 8, then 9 and then 7, the sum of these four measurements is 33. The contrast sensitivity value corresponding 33 is found in the table as 310.
![]()
![]()
![]()
[ Instructions I Paediatric Vision Tests I Vision Tests ]
This document was last modified on