Translating Results into Recommendations
Large surfaces at low contrast, like buildings, carry important information for moving whereas high contrast details are present in street names, in printed texts, comics and some pictures. In the life of young children, important information is present at low and intermediate contrast levels until they start learning letters.
Sensitivity at very low contrast levels at low spatial frequencies, which is measured in scientific studies, is not as important as testing at the intermediate contrast levels. This is much like hearing where it is not important to know the highest pitch perceived (comparable to visual acuity value) but what the function is at the intermediate frequencies where the information related to speech is located. Similarly, visual communication is located at intermediate frequencies, i.e. visual acuity values on both sizes of 0.1 (20/200, 6/60) and at moderately low levels (5% to 1.0%) of contrast.
Contrast should be considered in every day functions such as eating: light coloured food is placed on dark plates, dark coloured food on light coloured plates, a coloured glass is better than a clear one for drinking water and a small coaster in contrasting colour helps in localising the glass on a table. As children grow up, dusting, ironing, needlework and woodwork have important details at low contrast.
Children and adults with low contrast sensitivity have difficulties in seeing low contrast visual information in the environment: stairs when walking downstairs, curbs, unevenness of surfaces of streets, paths in white or very dark sand or snow on a cloudy day. A child with near normal visual acuity at high contrast but poor contrast sensitivity may need to use long cane techniques to improve independent moving. Low contrast sensitivity values of a child should make us look around in the environment and improve contrast of landmarks that the child uses (often different from what adult persons would use).
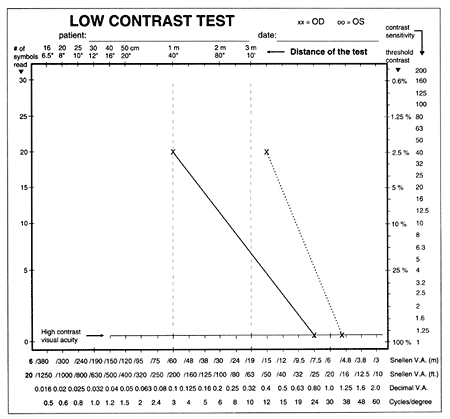
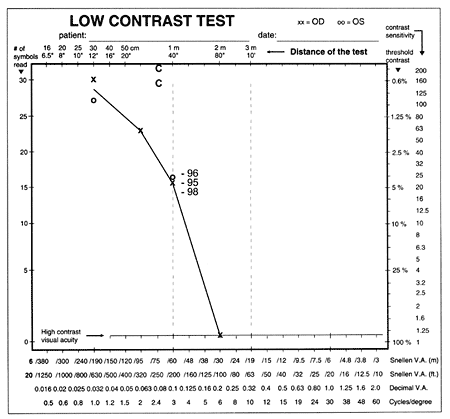
If a person/child complains loss of vision, low contrast tests may reveal the type of vision loss (Figure 6.A). On the other hand, it is important to know that there are boys and adult men with mild retinoschisis who have moderately low visual acuity (0.2, 20/100, 6/30 to 0.4, 20/50, 6/15) but normal contrast sensitivity at low visual acuities (Figure 6.B).
Figure 6.A

Figure 6.B

Figure 6.A. A two-line change in visual acuity due to an incipient cataract was still in the range of normal and did not explain the complaint of poor vision but the measurement at 2.5% contrast did: the change was 6 lines (from 0.4 to 0.1, from 20/50 to 20/200, from 6/15 to 6/60). B. Typical contrast sensitivity curve of a man with mild retinoschisis. The two values marked with C were measured with Cambridge Low Contrast Test.
The man whose contrast sensitivity curve is in Figure 6.B has had the same visual acuity of 0.2 (6/30, 20/100) since he was 8 years old, has completed a normal military service and functions well in traffic. At the age of 45 years when his vision was examined for renewal of his traffic licence, he had driven more than 1.5 million kilometres (1 million miles) without accidents or tickets. He is one of the living proofs that visual acuity at full contrast does not alone depict the quality of vision for performing well in traffic.
[ Instructions I Paediatric Vision Tests I Vision Tests ]
This document was last modified on