The Range of Normal Contrast Sensitivity
Among the normally sighted people, both visual acuity and contrast sensitivity have a wide range of variation. In visual acuity, 0.8 (20/25, 6/9) is a low normal value; the highest normal values are three times higher, 2.5 (20/8, 6/2.5)

Figure 4. The range of normal variation in both visual acuity values (horizontal arrow) and in contrast sensitivity (vertical arrow) is great. If a person's contrast sensitivity was previously A and has then decreased to A', the value is still within the range of normal values but is highly pathologic to this person.
The range of normal variation in contrast sensitivity values is great. Therefore, a value within the range of normal values may or may not mean that a particular person has normal contrast sensitivity. If his or her contrast sensitivity was previously high, it may decrease to less than one-half or one-third of its original value (A to A’ in the Figure 4) and can still be within the normal values. A change in contrast sensitivity is a diagnostically important feature that will be watched in the future. Because of the large variation in the normal values, we need to compare the present value with an older value, measured with the same test.
Ideally, contrast sensitivity and visual acuity values should be measured at close and far distance when children leave their high school/ secondary school or in young adulthood. These values should be recorded and saved as part of the basic information related to each person's health. A change warrants an examination to find out the cause of the change. Although the most common cause would be a small change in the refractive power of the eye, which is a benign finding, repeating the measurement of visual acuity at low contrast levels would be beneficial as a part of health examinations.
Measurement of contrast sensitivity would also help us to better understand the complaints of a person whose visual acuity at high contrast has not changed but whose vision has decreased at low contrast levels. Then we would not annoy him/her by saying that his/her vision is as good as before, a situation which is now experienced by many patients/clients.

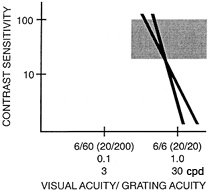
Figure 5. Variation in the declination of the slope in normal subjects.
If occupational tasks require good visual function at low contrast levels, visual acuity at full contrast alone does not select the most suitable persons for that particular task. For example, if the task is to notice airplanes approaching within low clouds, these planes are best seen by a person with good visual acuity in the contrast range of 1-5%. Since the declination of the slope varies even in normal individuals, it is possible that a person with lower visual acuity at full contrast has better function at the lower contrast levels than a person who has higher visual acuity at high contrast. This is important to remember in occupational tasks that require exceptionally good visual function at low contrast levels.
Figure 5 will be helpful if you need to explain why a person with lower visual acuity at full contrast but higher at low contrast levels than another worker has better vision for tasks that require detection and discrimination at low contrast levels.
[ Instructions I Paediatric Vision Tests I Vision Tests ]
This document was last modified on